# Import packages
from dash import Dash, html, dash_table, dcc, callback, Output, Input
import pandas as pd
import plotly.express as px
# Incorporate data
#df = pd.read_csv('https://raw.githubusercontent.com/plotly/datasets/master/gapminder2007.csv')
# Initialize the app
app = Dash(__name__)
# App layout
app.layout = html.Div([
html.Div(children='My First App with Data, Graph, and Controls'),
html.Hr(),
dcc.RadioItems(options=['pop', 'lifeExp', 'gdpPercap'], value='lifeExp', id='controls-and-radio-item'),
dash_table.DataTable(data=pd.read_csv('https://raw.githubusercontent.com/plotly/datasets/master/gapminder2007.csv').to_dict('records'), page_size=6),
dcc.Graph(figure={}, id='controls-and-graph')
])
# Add controls to build the interaction
@callback(
Output(component_id='controls-and-graph', component_property='figure'),
Input(component_id='controls-and-radio-item', component_property='value')
)
def update_graph(col_chosen):
import plotly.express as px
import pandas as pd
fig = px.histogram(pd.read_csv('https://raw.githubusercontent.com/plotly/datasets/master/gapminder2007.csv').to_dict('records'), x='continent', y=col_chosen, histfunc='avg')
return figExample #1
Dash Apps
The examples in folder_dash are the standard demo apps. They can be run from the command line and are served through local host
 ➜  python_dash git:(main) ✗ python3 data_table_py_callback.py
Dash is running on http://127.0.0.1:8050/

 * Serving Flask app 'data_table_py_callback'
 * Debug mode: on
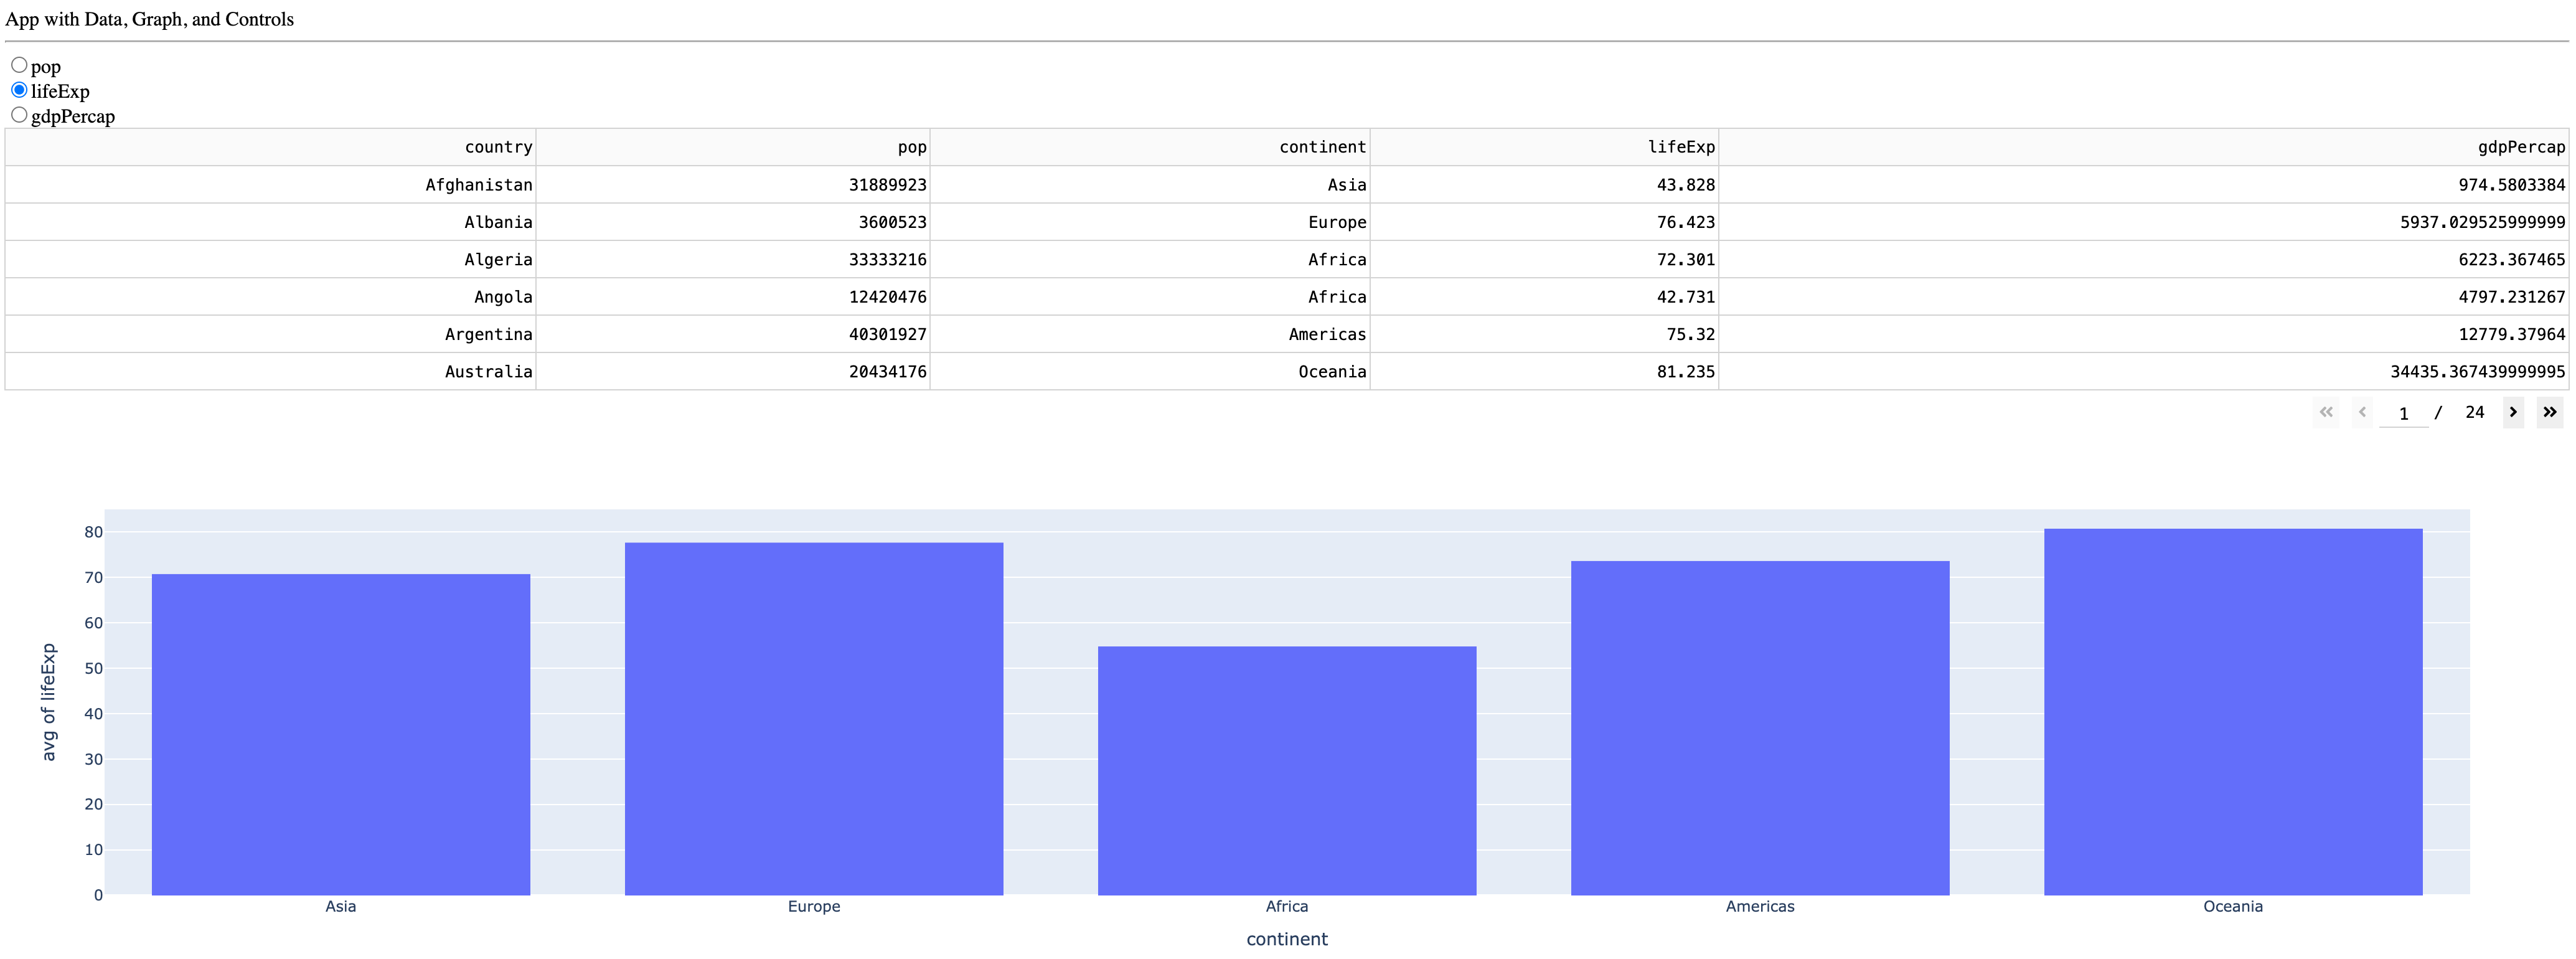
It looks like this and seems to work as expected:

Dash within Quarto
Running a Dash app within Quarto was possible with ugly hacks but it isn’t pretty. May not work properly and is not supported. Simply a code exploration to be ignored. Kept in the same way that a journal of negative results is a good thing.
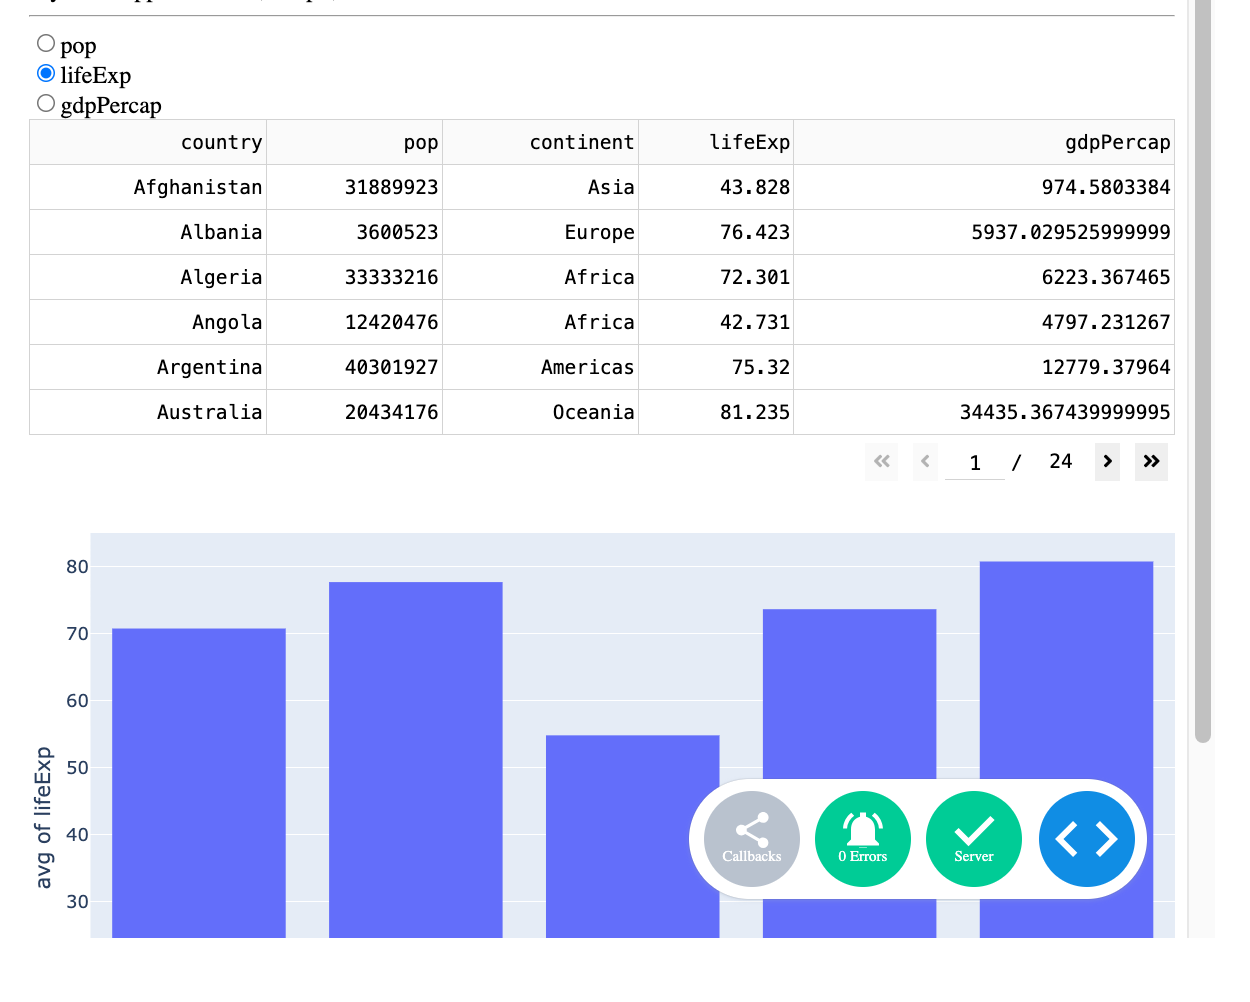
When Dash server is running on localhost it looks like this:

ie. is squashed within the page
Show Code
if __name__ == '__main__': app.run(debug=True) # Run the app